
Note: This post carries on from Part 3.
Testing & Reporting
Now that you’ve set up your lab, you can start working on the VSHs.
Test #1 - TCP Options
Usually when telnetting between two routers (e.g PC-A-01 and PC-B-01), the MSS negotiated is 536 and no other options are specified. However, after configuring the VSHs to optimise telnet traffic, you can see the VSHs and Enhanced Auto discovery in action:
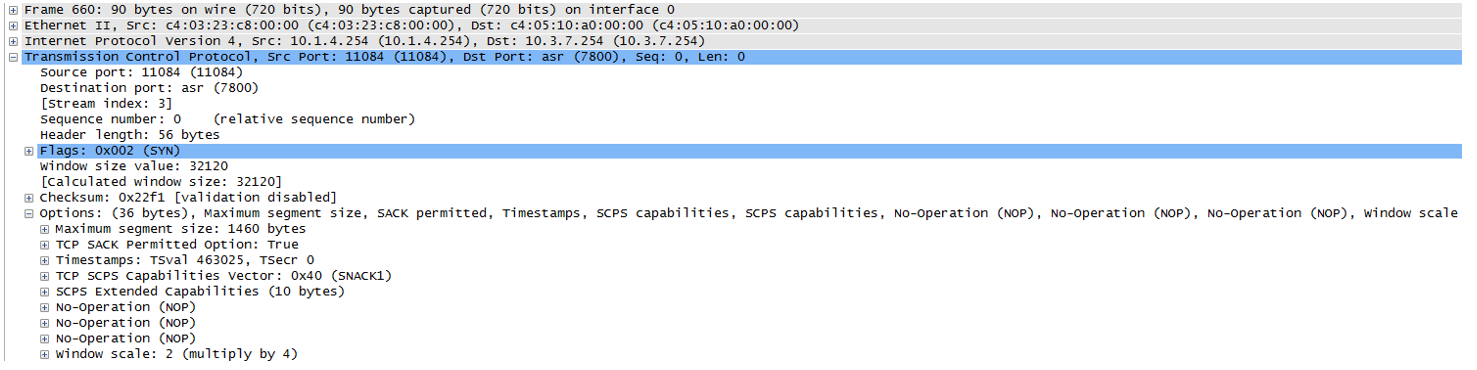
These enhanced settings won’t make much of a difference where Telnet traffic is concerned, but this sort of test can be useful for those who cannot run the Windows XP VMs due their PC’s performance.
Test #2 - HTTP
In this example VM-PC-2 is running a web server and VM-PC-1 downloads a 10mb file from it. See the results below:
Cold Transfer:
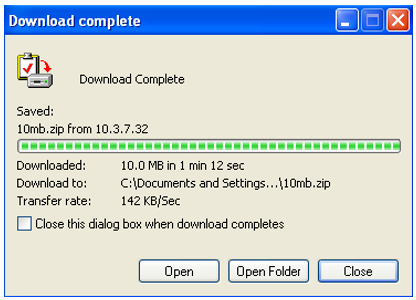
10mb was downloaded in 1 minute and 12 seconds. The transfer rate was 142KB/sec.
When the file is downloaded a second time the results are very different:
Warm Transfer:
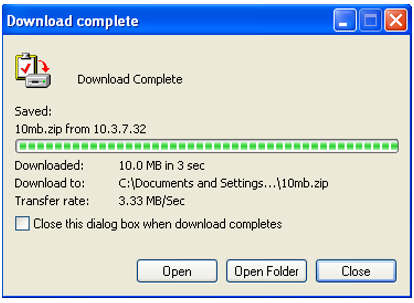
10mb was downloaded in 3 seconds. The transfer rate was 3.33MB/sec.
Results:
As explained in the “Transfer Speeds” section in Part 3, GNS3’s slow throughput dramatically, resulting in a speed which replicates a very slow WAN link. We see this in the the “Cold Transfer” test above. However, as per the “Warm Transfer” test, the VSH’s local caching is able to resolve this issue the second time the data is required.
Test #3 - iperf
In this test iperf is run between VM-PC-1 and VM-PC-2. The test runs for 15 seconds and outputs the results every 1 second.
The first test is run with optimisation disabled and achieves an average speed of 811Kb/sec and transfers a total of 1.62MB.
C:\>c:\iperf\iperf.exe -c 10.3.7.32 -i 1 –t 15
------------------------------------------------------------
Client connecting to 10.3.7.32, TCP port 5001
TCP window size: 64.0 KByte (default)
------------------------------------------------------------
[  3] local 10.1.4.31 port 1052 connected with 10.3.7.32 port 5001
[ ID] Interval       Transfer     Bandwidth
[  3]  0.0- 1.0 sec   128 KBytes  1.05 Mbits/sec
[  3]  1.0- 2.0 sec   128 KBytes  1.05 Mbits/sec
[  3]  2.0- 3.0 sec  0.00 Bytes  0.00 bits/sec
[  3]  3.0- 4.0 sec   128 KBytes  1.05 Mbits/sec
[  3]  4.0- 5.0 sec   128 KBytes  1.05 Mbits/sec
[  3]  5.0- 6.0 sec   128 KBytes  1.05 Mbits/sec
[  3]  6.0- 7.0 sec  0.00 Bytes  0.00 bits/sec
[  3]  7.0- 8.0 sec   128 KBytes  1.05 Mbits/sec
[  3]  8.0- 9.0 sec   128 KBytes  1.05 Mbits/sec
[  3]  9.0-10.0 sec   128 KBytes  1.05 Mbits/sec
[  3] 10.0-11.0 sec  0.00 Bytes  0.00 bits/sec
[  3] 11.0-12.0 sec   128 KBytes  1.05 Mbits/sec
[  3] 12.0-13.0 sec   128 KBytes  1.05 Mbits/sec
[  3] 13.0-14.0 sec   128 KBytes  1.05 Mbits/sec
[  3] 14.0-15.0 sec   128 KBytes  1.05 Mbits/sec
[  3]  0.0-16.8 sec  1.62 MBytes   811 Kbits/sec
The second test is run with optimisation enabled and achieves an average speed of 194Mb/sec and transfers a total of 347MB.
C:\>c:\iperf\iperf.exe -c 10.3.7.32 -i 1 –t 15
------------------------------------------------------------
Client connecting to 10.3.7.32, TCP port 5001
TCP window size: 64.0 KByte (default)
------------------------------------------------------------
[  3] local 10.1.4.31 port 1055 connected with 10.3.7.32 port 5001
[ ID] Interval       Transfer     Bandwidth
[  3]  0.0- 1.0 sec  9.38 MBytes  78.6 Mbits/sec
[  3]  1.0- 2.0 sec  12.5 MBytes   105 Mbits/sec
[  3]  2.0- 3.0 sec  18.1 MBytes   152 Mbits/sec
[  3]  3.0- 4.0 sec  30.8 MBytes   258 Mbits/sec
[  3]  4.0- 5.0 sec  12.4 MBytes   104 Mbits/sec
[  3]  5.0- 6.0 sec  47.0 MBytes   394 Mbits/sec
[  3]  6.0- 7.0 sec  12.9 MBytes   108 Mbits/sec
[  3]  7.0- 8.0 sec  23.8 MBytes   199 Mbits/sec
[  3]  8.0- 9.0 sec  43.2 MBytes   363 Mbits/sec
[  3]  9.0-10.0 sec  44.2 MBytes   371 Mbits/sec
[  3] 10.0-11.0 sec  18.5 MBytes   155 Mbits/sec
[  3] 11.0-12.0 sec  15.5 MBytes   130 Mbits/sec
[  3] 12.0-13.0 sec  8.88 MBytes  74.4 Mbits/sec
[  3] 13.0-14.0 sec  22.5 MBytes   189 Mbits/sec
[  3] 14.0-15.0 sec  27.0 MBytes   226 Mbits/sec
[  3]  0.0-15.0 sec   347 MBytes   194 Mbits/sec
Note: The reason why there are such high speeds in the second test is because iperf most probably sends the same data over and over again, therefore the transfer would be mostly local between the PC and the VSH.
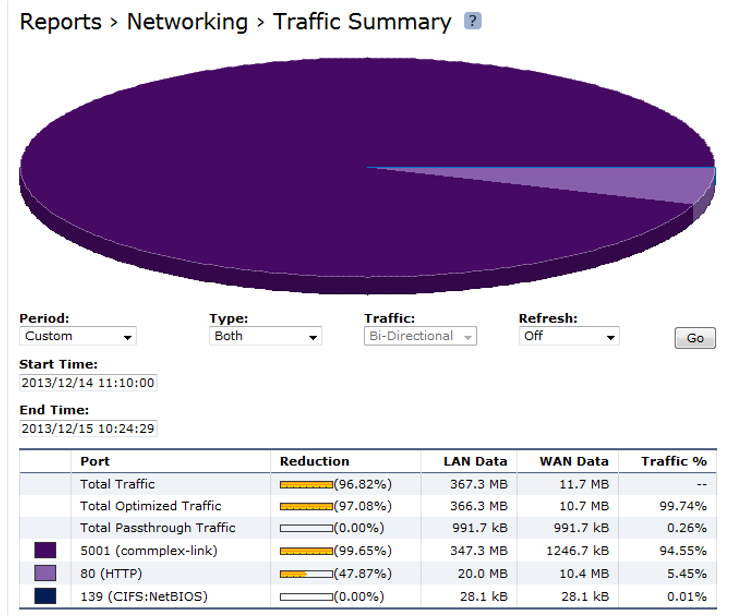
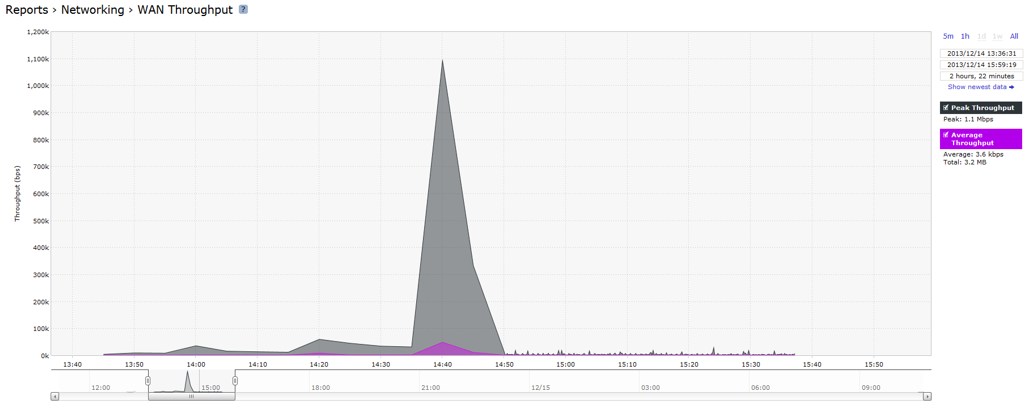
Reports
After running the above tests, you can view the various reports the VSHs create. Below are a couple of examples:
Final Notes
Physical & Virtual Labs
Using GNS3’s Cloud nodes and few physical NICs in your PC, you can connect your VSHs to a real network. There are two major benefits of doing this:
- You can add IOS switches to your network (which GNS3 does not support).
- The throughput restrictions caused by GNS3 (as covered in the “Transfer Speeds” section above) can be avoided completely. You can then add as many routers to your topology as you like. Shaping can then be used on the “WAN” router’s edge ports to emulate a WAN link’s speed.
See my Ultimate Cisco Lab website for a step by step guide on how to achieve this.
Host File & DNS
You can edit your PC and VM’s Host files so that you can use names instead of IP addresses when accessing devices and performing pings. However, it would be a better idea to set up a small DNS server so that your VSH’s reports will be more informative.
Adding NetApp Simulators
If you’re interested in extending your lab, take a look at my Connecting the NetApp Simulator to your Virtual and Physical Labs and Trunking VLANs between the NetApp Simulator and GNS3 posts.
This will give you a lab which consist of Cisco routing and switching, Riverbed WAN Optimisation and NetApp Storage, all in a single PC/laptop. How great is that?
As always, if you have any questions or have a topic that you would like me to discuss, please feel free to post a comment at the bottom of this blog entry, e-mail at will@oznetnerd.com, or drop me a message on Reddit (OzNetNerd).
Note: The opinions expressed in this blog are my own and not those of my employer.

Leave a comment